
By Ian C. Schick, PhD, JD, CEO & Co-founder of Specifio (first posted on blog.specif.io)
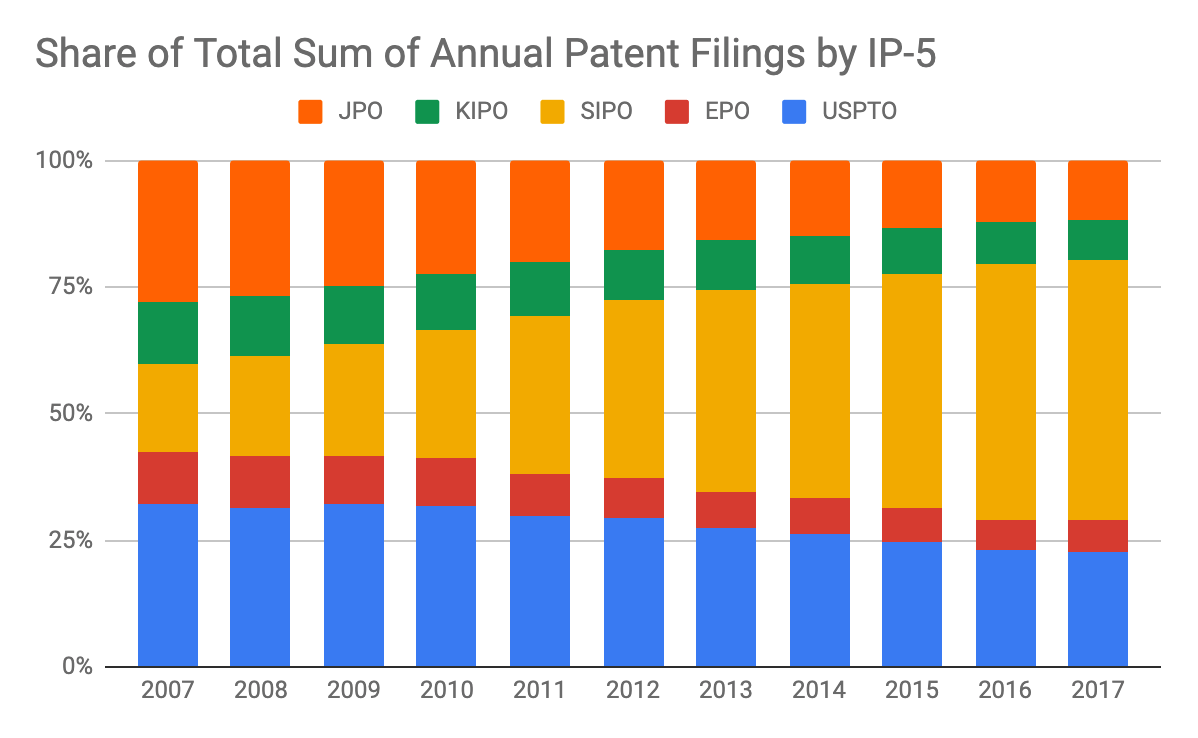
The top five intellectual property offices in the world, also known as the IP-5, dominate the global patent market. In 2017, the IP-5 received approximately 85% of the 3.17M patent applications filed worldwide. Showing no signs of slowing down, the IP-5 have increased their collective share of the global patent market by 10% in the last decade. The graph below shows annual patent filings for the IP-5 offices from 2007 to 2017.

A significant portion of the global growth of patent applications is attributed to China’s State Intellectual Property Office (SIPO; recently renamed to CHIPA). For example, the SIPO received 1.38M patent applications in 2017, which accounts for more than 43% of the global market share and beats the four other IP-5 offices combined. Following China and the U.S., the Japan Patent Office (JPO) ranked third with 318,479 applications, Korean Intellectual Property Office (KIPO) ranked fourth with 204,775, and the European Patent Office (EPO) came in last at 166,585. Asia, primarily China, South Korea, and Japan, has strengthened itself as the leading region with the highest patent filing activity, accounting for more than 65% of the world in 2018. While the SIPO doubles the second largest office, the United States Patent Trademark Office (USPTO), the U.S. has still experienced seven consecutive years of growth in applications. However, when matched with the strong growth of the SIPO, the USPTO, along with the four other IP-5 offices, have actually seen their shares of the global market decrease (see graph below).
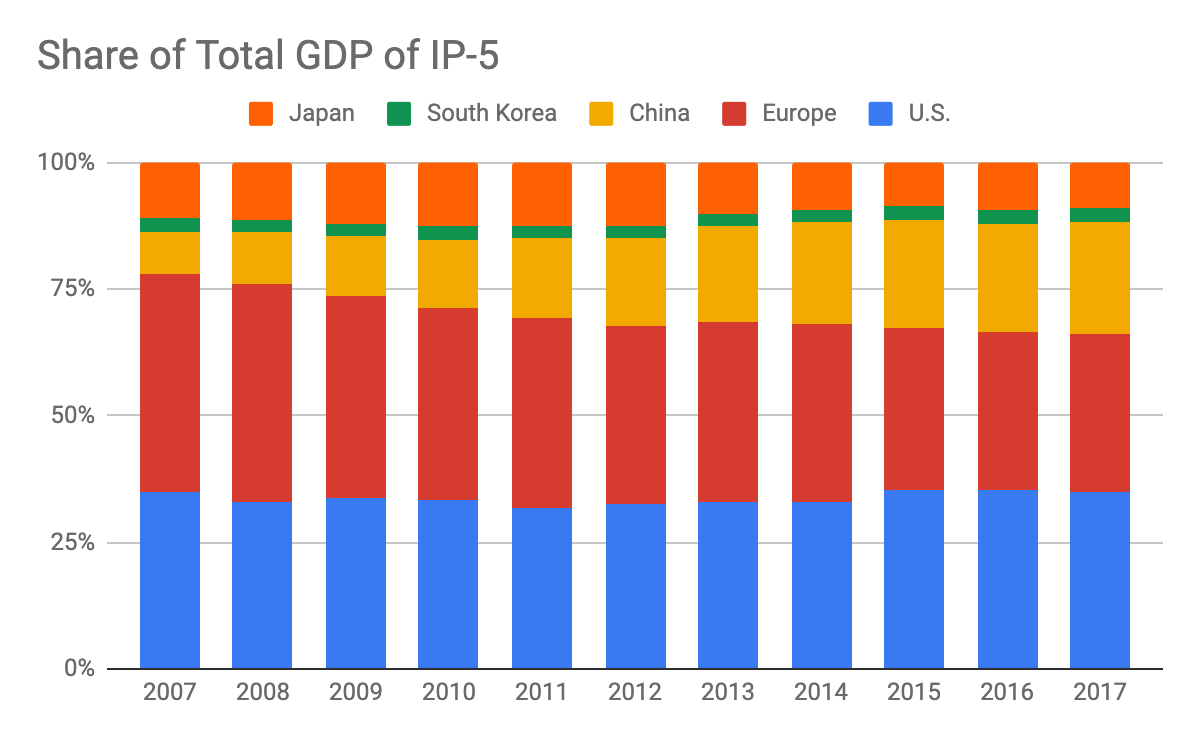
This article explores whether there is any strong correlation between annual real gross domestic product (GDP) of the individual IP-5 jurisdictions and their annual patent filing trends. Indicative of economic well-being, GDP measures the total economic output of the goods and services of a country or region adjusted for the effects of inflation. The plot below shows the different GDPs for the IP-5.

Following the recent Great Recession, the U.S. and China have quickly rebounded and have shown no signs of slowing down with respect to economic growth, while the other remaining economies have responded differently. Since 2009, American GDP has been on an upward trend, overtaking Europe as the largest economy in the world. Europe’s GDP has fluctuated the most, hovering between 16 and 19 trillion. China has experienced tremendous growth in the past couple of years, while South Korea, on the other hand, appears to be relatively stagnant in the last decade. China’s GDP has grown more than 60% from 2007 to 2017, getting closer to Europe and the U.S. China and Japan, who were at similar GDP levels in 2007, went in different directions with China achieving significant growth in the last decade, while Japan remained at roughly the same level. Despite the recent growth in the US’s GDP, its share of the total GDP of the IP-5 has held relatively flat, as shown in the graph below.
To see how, if at all, annual patent filings correlate with GDP, we have calculated the number of patents filed per unit of GDP, which is plotted in the graph below. This figure is sometimes referred to as a “patent activity intensity” indicator. While variations in the number of patent filings demonstrate the size and level of development of the economy, this graph offers an alternative measurement that enables the comparison of the number of patent applications among countries with different-sized economies.

For a perfectly linear relationship between annual patent filings and GDP, we would expect to see flat lines in the graph above. Indeed, that appears to be the case for both the U.S. and Europe, despite the rising GDP of the U.S. and the sluggish GDP of Europe. In these jurisdictions, economic growth/contraction appears directly related to the rate of innovation measured by annual patent filings.
This apparent correlation disappears, however, when we look at Asia. South Korea started and ended the decade with the most patents filed per unit GDP, but it slowly decreased in general. China’s rate of annual patent filings has largely outpaced its growth in GDP as indicated by the rising trend in patents filed per unit GDP. Since Japan’s GDP took a downward turn in 2012, their patents filed per GDP has mostly risen even though their total number of annual filings has been in a steady decline over the last decade.
In summary, smaller economies tend to have more patents filed per unit GDP. This could be a function of GDP, but other factors, such as local labor costs for preparing patent applications, are likely at play. The U.S. and Europe show a strong linear relationship between annual patent filings and GDP. While not as stable as the U.S. and Europe, Korea’s patent filings also demonstrate a fairly stable linear relation to GDP. Japan and China, however, at least in recent years, have increased the number of patents filed per GDP. This may be due to confidence toward the respective patent systems and the value of patents for economic growth. In our next post, we’ll look at trends in resident versus non-resident patent filings in the IP-5 to shed additional light on the optimism toward each of the different IP-5 jurisdictions.
Data Sources:
- WIPO Facts and Figures 2018
- World Intellectual Property Indicators 2018
- Annual Real GDP Statistics for U.S., China, South Korea, Japan, and EU: https://data.worldbank.org/indicator/NY.GDP.MKTP.CD
- Annual Patent Filing Data for IP-5 (2011-2017): IP-5 Statistics Report 2011-2018, Four-Office Statistics Report (2008 – 2010), World Bank Indicator https://data.worldbank.org/indicator/IP.PAT.NRES, and WIPO Statistics https://www.wipo.int/ipstats/en/statistics/country_profile/profile.jsp?code=CN.
Featured on:
