Patent Filing Behavior Among Resident and Non-Resident Entities

By Ian C. Schick, PhD, JD, CEO & Co-founder of Specifio (first posted on blog.specif.io)

In our previous blog post, we explored how annual patent filings may be an indicator of optimism towards the strength of a jurisdiction’s patent system and its underlying economy. This article picks up the analysis to shed light on the effects of resident status on filing behavior over the past decade among the top five patent markets–US, China, Japan, Europe, and Korea–known as the IP-5.

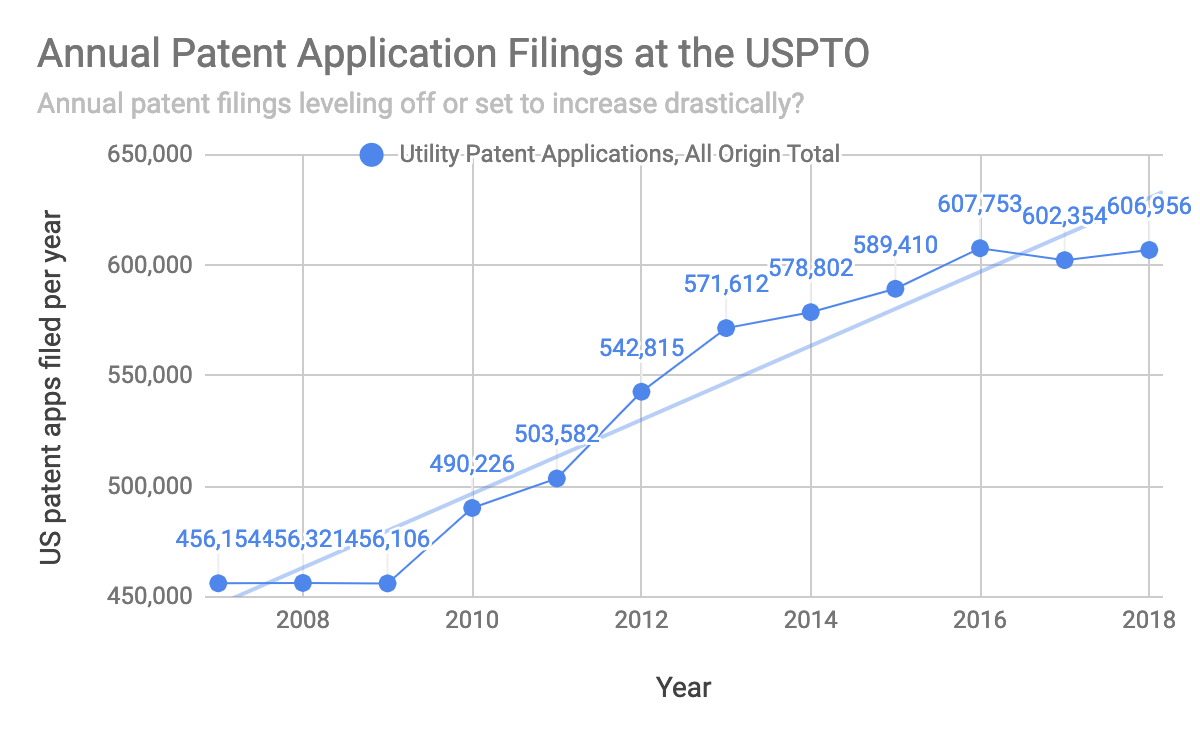
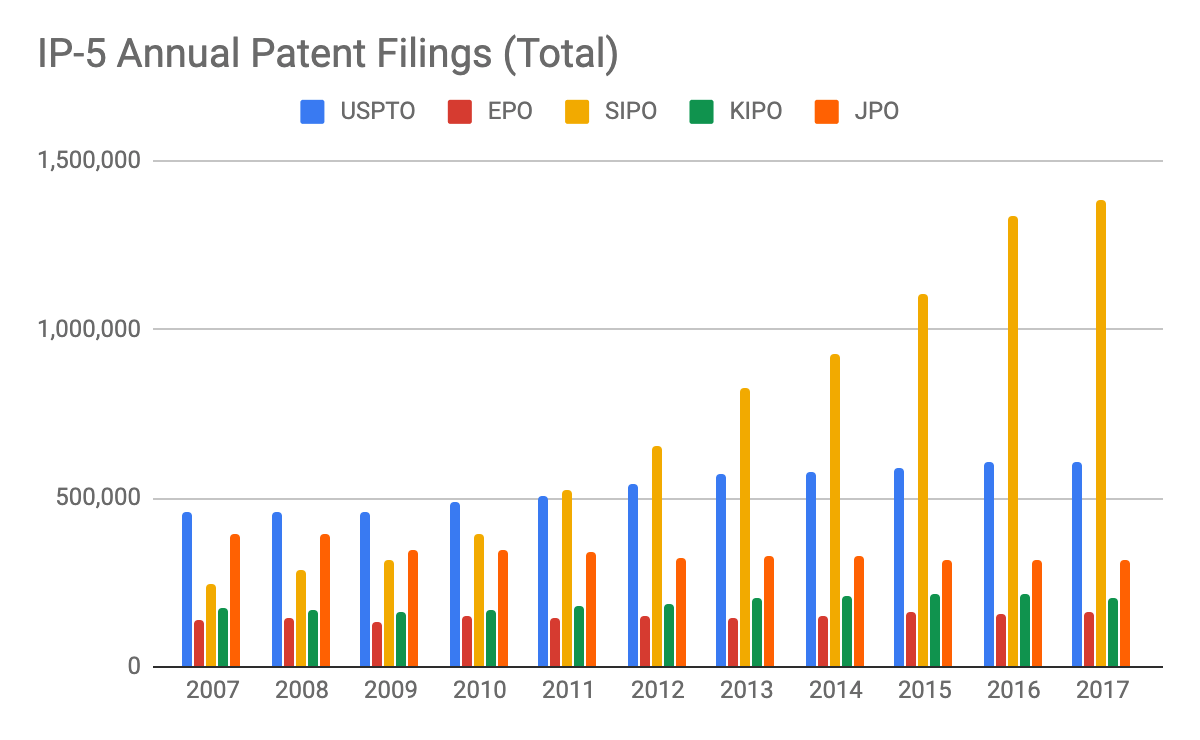
The graph below shows the total number of patent applications filed each year in the IP-5 jurisdictions, with non-resident and resident filers aggregated together. At a glance, filing activity appears relatively stable with modest changes, at least compared to the rapid ascent and shear volume of Chinese patent filings.

Separating resident and non-resident filings shows interesting differences between the two categories of participants in each of the economies of the IP-5 jurisdictions. The graph below shows the number of patent applications filed by residents in each IP-5 jurisdiction.

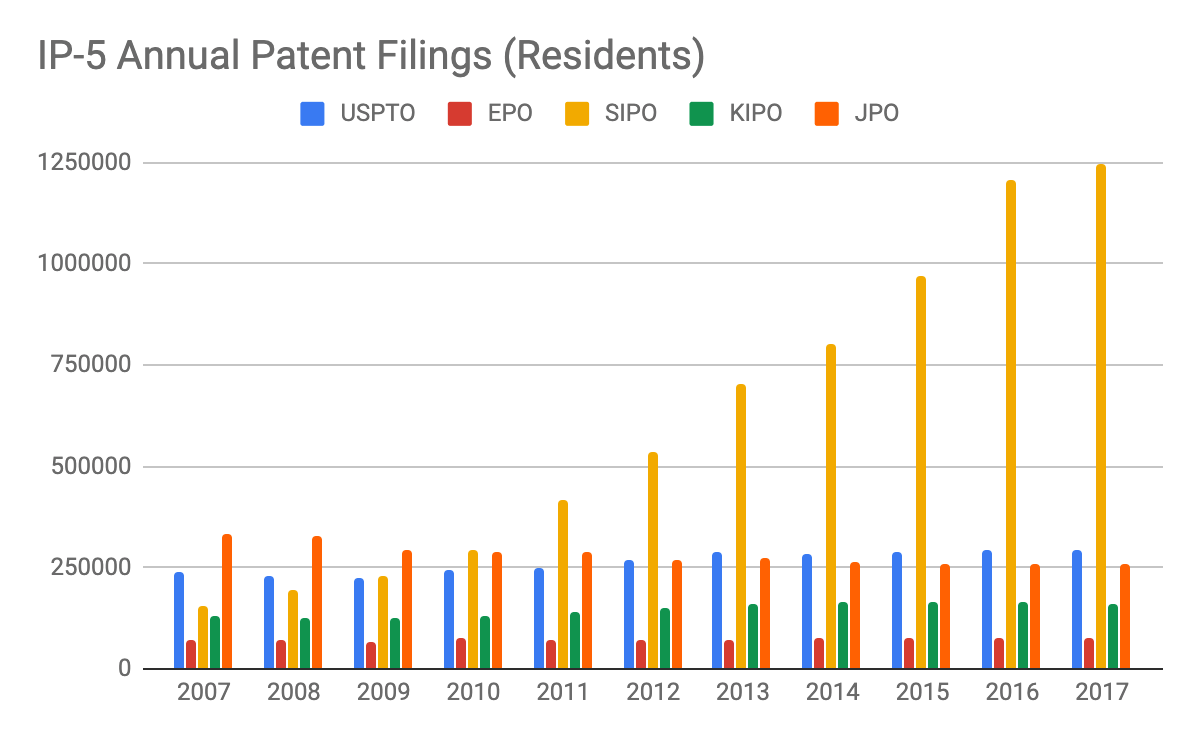
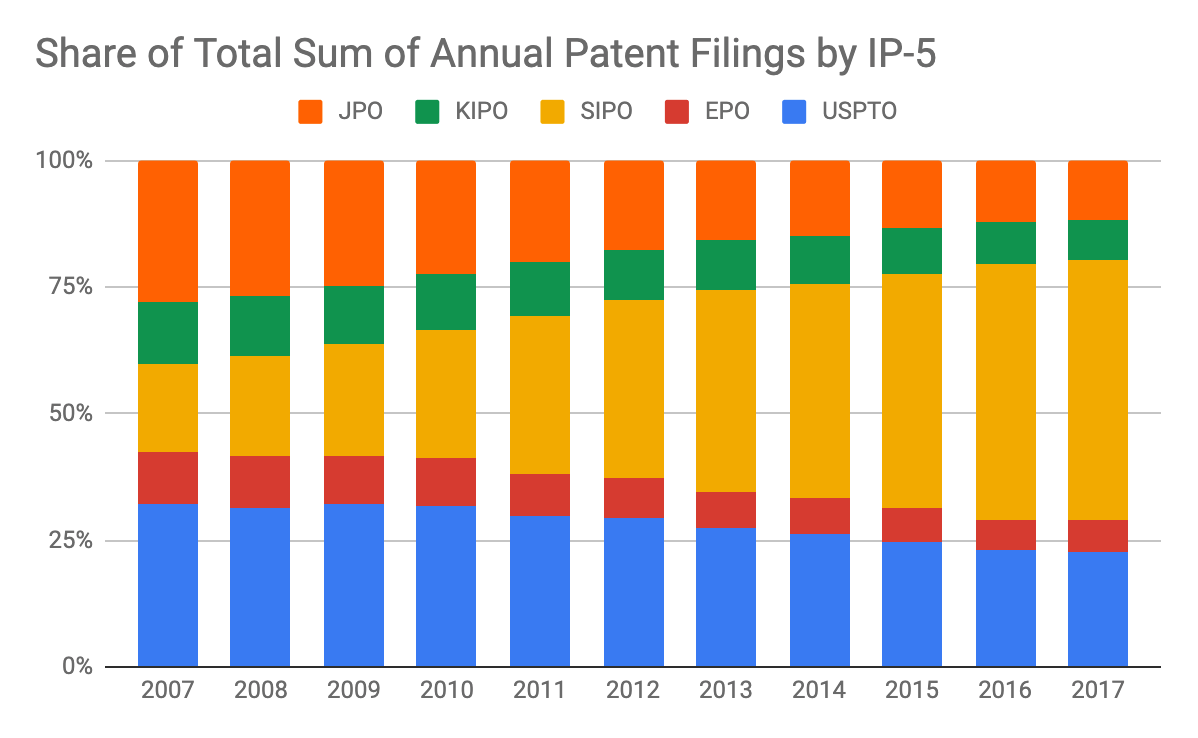
In China, a hugely disproportionate amount of patent applications are filed domestically. In the last decade, 85% of patent applications filed with China’s National Intellectual Property Administration (CNIPA; shown in the figures with the former name, “SIPO”) were resident-based. From 2007 to 2017, China’s total number of domestic patents equaled 6.74M, which is roughly the same as the resident output of the U.S., Europe, and Japan combined. It would be interesting to see how this dramatic increase in filings has affected the number of those practicing patent law in China.

China has boosted domestic patent production though a number of initiatives. The country has seen significant investments in innovation, such as artificial intelligence. Also, there are patent-promoting policies, such as subsidized patent filing fees, rewards for patent filings, and tax credits related to patent output. China has assuaged examination guidelines for software and business methods patents and streamlined the examination process for rapidly expanding sectors, such as cloud, big data, and internet.

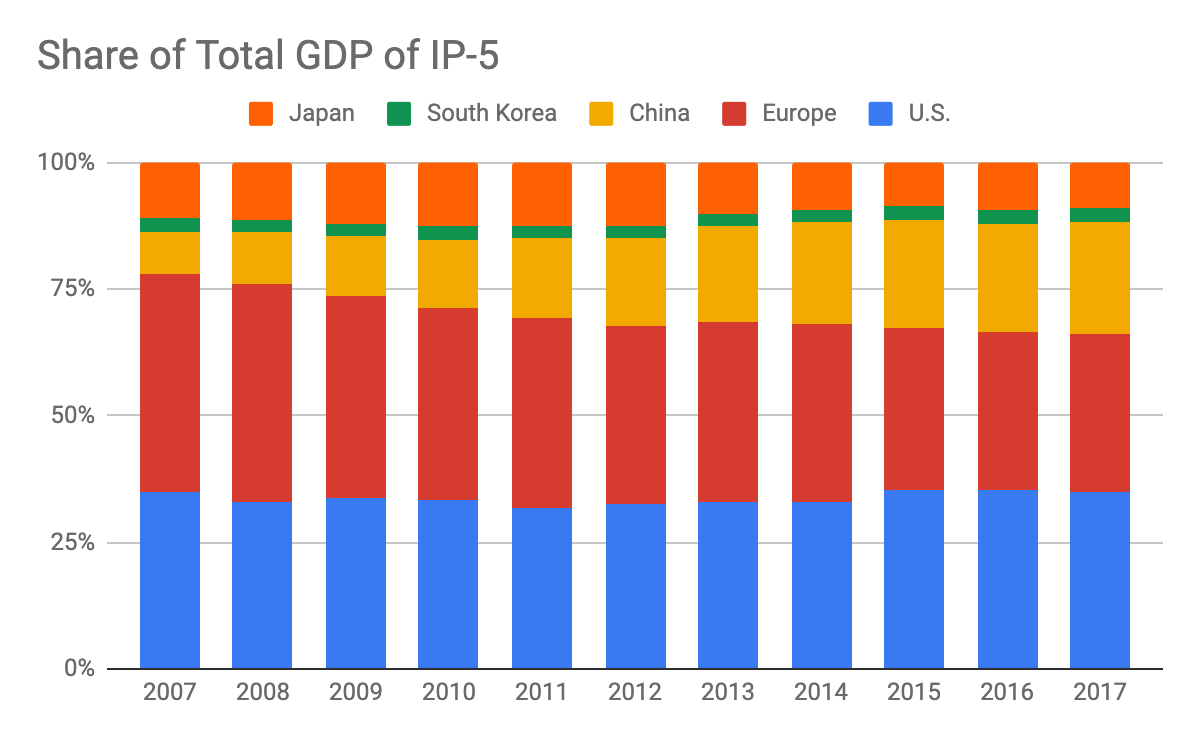
While Japan’s resident fillings have fallen, South Korea, Europe, and the U.S. have seen steady increases, suggesting a possible correlation with the positive economic activity of these jurisdictions. In the last decade, Japan’s resident patent filings, however, have steadily decreased by more than 20%, which may be explained by a sluggish national economy struggling to get back on its feet.

The graph below depicts the number of patent applications filed by non-residents for each IP-5 jurisdiction.

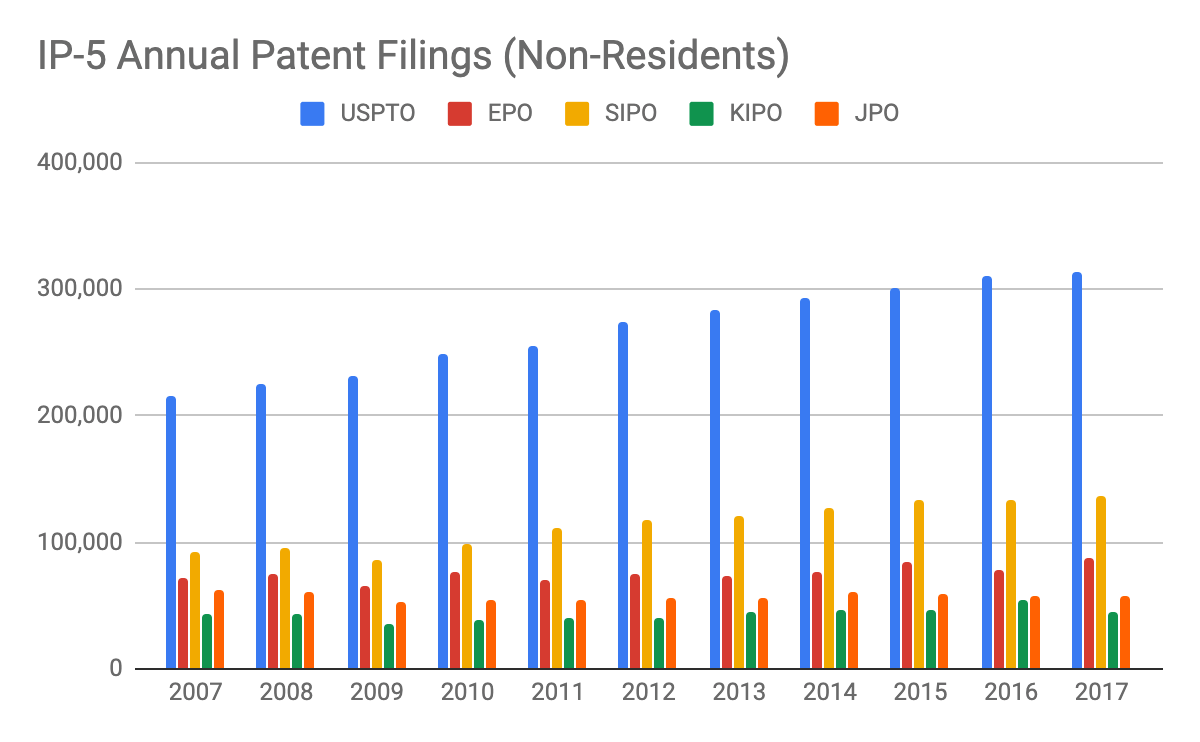
As illustrated above, the United States Patent Trademark Office (USPTO) is clearly the most popular destination for non-resident patent filings. For almost every single year in the last decade, more than half of the applications filed with the USPTO were of foreign origin. As the largest economy in the world, it makes sense that entrepreneurs and inventors want to file patents in the U.S. Due to the thoroughness of American patent law, the U.S. offers arguably stronger patent protection than other countries or regions.

Similar to the U.S., Europe has significantly more non-resident than resident patent filings, which may be due to the same reasons mentioned above. The U.S. and Europe have the most balanced production of domestic and foreign patent filings. The Asian market, on the other hand, is dominated by domestic patents. In the last decade, non-resident filings made up less than a quarter of total patent filings for China (15%), Japan (20%), and South Korea (23%).

In the plots below, resident and non-resident filings have been normalized to more easily compare the “shape” of the filing trends. This graph has been created so that maximum annual filings over the past decade are scaled to equal to one, while the minimum is scaled to equal zero.

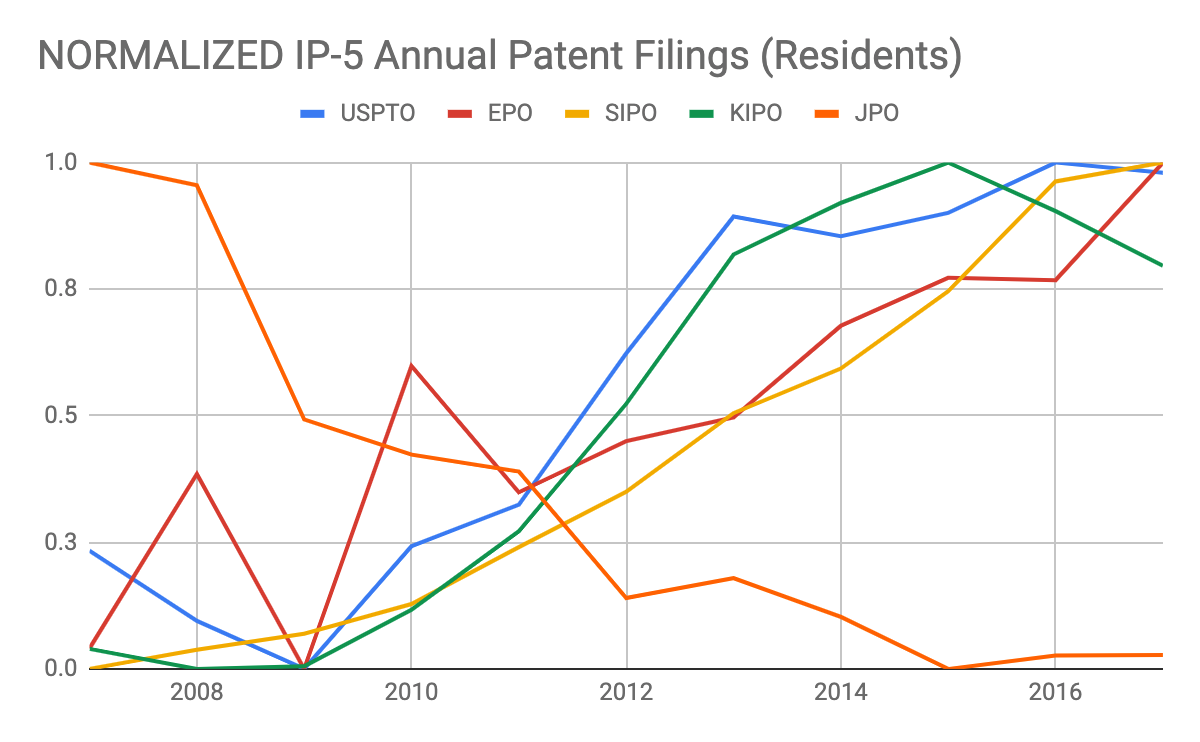
It appears all IP-5 jurisdictions, except China, took a significant dive in 2009 with the USPTO, EPO, and KIPO hitting a local minimum. Japan’s steepest fall was from 2008 to 2009, but its patent filings did not bottom out until 2015. U.S. resident fillings also saw a dip in 2014, which is presumably due to the Alice and Mayo cases that cast doubt on the patentability of certain fields of innovation. It is not immediately clear what factors caused the volatility in Korean resident filings.

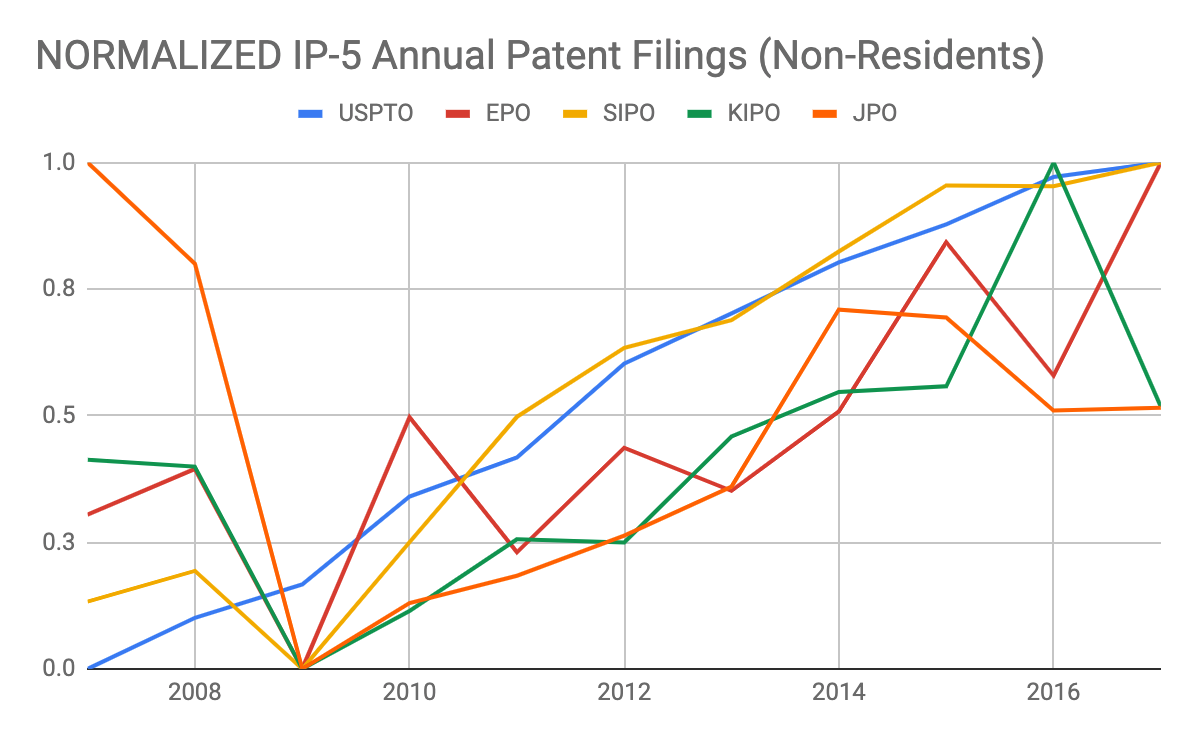
We see above that foreign filing entities maintained confidence in American patents through the economic crisis and the Alice-Mayo fallout with barely any fluctuations in steady year-after-year increases. Non-resident filings among the remaining IP-5, however, hit a low in 2009, but have mainly risen since.

The U.S. and China are the clear favorites in the international patent market, but in different ways. China is a mass-producer of domestic patents in part due to their favorable policies and incentives, while the U.S. has maintained a more balanced approach with a healthy influx of foreign patents. By integrating resident and non-resident factors into this analysis, we have gained deeper insight into the productivity and health of each jurisdiction, as well as the sensitivity of the overall market to external factors. Although Europe is the smallest producer of patents among the IP-5, they are still known for having one of the highest ratios of foreign-based patents, which is a testament to their strong patent system. It will be interesting to monitor the production trends of these different countries moving forward and whether they decide to take a quality or quantity approach in production.

So what does all this mean for practitioners?  We see above that diversifying clientele to include non-resident U.S. patent fliers and resident Chinese patent-filers could help weather economic downturns, which more often is followed by dips in patent filings. Furthermore, In order to chase Chinese patent work, practitioners’ best chances may be to develop business among Chinese resident filers.  

Data Sources:

  1. Increases in Innovation, Patent Boom Leads to Development in China http://www.ipwatchdog.com/2018/04/18/increases-innovation-patent-boom-development-china/id=95994/.
  2. Annual Patent Filing Data for IP-5 (2011-2017): IP-5 Statistics Report 2011-2018, Four-Office Statistics Report (2008 – 2010), World Bank Indicator https://data.worldbank.org/indicator/IP.PAT.NRES, and WIPO Statistics https://www.wipo.int/ipstats/en/statistics/country_profile/profile.jsp?code=CN.

Featured on:

Groen zwart.png

The Relationship Between Annual Patent Filings and GDP

By Ian C. Schick, PhD, JD, CEO & Co-founder of Specifio (first posted on blog.specif.io)

The top five intellectual property offices in the world, also known as the IP-5, dominate the global patent market. In 2017, the IP-5 received approximately 85% of the 3.17M patent applications filed worldwide. Showing no signs of slowing down, the IP-5 have increased their collective share of the global patent market by 10% in the last decade. The graph below shows annual patent filings for the IP-5 offices from 2007 to 2017.

A significant portion of the global growth of patent applications is attributed to China’s State Intellectual Property Office (SIPO; recently renamed to CHIPA). For example, the SIPO received 1.38M patent applications in 2017, which accounts for more than 43% of the global market share and beats the four other IP-5 offices combined. Following China and the U.S., the Japan Patent Office (JPO) ranked third with 318,479 applications, Korean Intellectual Property Office (KIPO) ranked fourth with 204,775, and the European Patent Office (EPO) came in last at 166,585. Asia, primarily China, South Korea, and Japan, has strengthened itself as the leading region with the highest patent filing activity, accounting for more than 65% of the world in 2018. While the SIPO doubles the second largest office, the United States Patent Trademark Office (USPTO), the U.S. has still experienced seven consecutive years of growth in applications. However, when matched with the strong growth of the SIPO, the USPTO, along with the four other IP-5 offices, have actually seen their shares of the global market decrease (see graph below).

This article explores whether there is any strong correlation between annual real gross domestic product (GDP) of the individual IP-5 jurisdictions and their annual patent filing trends. Indicative of economic well-being, GDP measures the total economic output of the goods and services of a country or region adjusted for the effects of inflation. The plot below shows the different GDPs for the IP-5.

Following the recent Great Recession, the U.S. and China have quickly rebounded and have shown no signs of slowing down with respect to economic growth, while the other remaining economies have responded differently. Since 2009, American GDP has been on an upward trend, overtaking Europe as the largest economy in the world. Europe’s GDP has fluctuated the most, hovering between 16 and 19 trillion. China has experienced tremendous growth in the past couple of years, while South Korea, on the other hand, appears to be relatively stagnant in the last decade. China’s GDP has grown more than 60% from 2007 to 2017, getting closer to Europe and the U.S. China and Japan, who were at similar GDP levels in 2007, went in different directions with China achieving significant growth in the last decade, while Japan remained at roughly the same level. Despite the recent growth in the US’s GDP, its share of the total GDP of the IP-5 has held relatively flat, as shown in the graph below.

To see how, if at all, annual patent filings correlate with GDP, we have calculated the number of patents filed per unit of GDP, which is plotted in the graph below. This figure is sometimes referred to as a “patent activity intensity” indicator. While variations in the number of patent filings demonstrate the size and level of development of the economy, this graph offers an alternative measurement that enables the comparison of the number of patent applications among countries with different-sized economies.

For a perfectly linear relationship between annual patent filings and GDP, we would expect to see flat lines in the graph above. Indeed, that appears to be the case for both the U.S. and Europe, despite the rising GDP of the U.S. and the sluggish GDP of Europe. In these jurisdictions, economic growth/contraction appears directly related to the rate of innovation measured by annual patent filings.

This apparent correlation disappears, however, when we look at Asia. South Korea started and ended the decade with the most patents filed per unit GDP, but it slowly decreased in general. China’s rate of annual patent filings has largely outpaced its growth in GDP as indicated by the rising trend in patents filed per unit GDP. Since Japan’s GDP took a downward turn in 2012, their patents filed per GDP has mostly risen even though their total number of annual filings has been in a steady decline over the last decade.

In summary, smaller economies tend to have more patents filed per unit GDP. This could be a function of GDP, but other factors, such as local labor costs for preparing patent applications, are likely at play. The U.S. and Europe show a strong linear relationship between annual patent filings and GDP. While not as stable as the U.S. and Europe, Korea’s patent filings also demonstrate a fairly stable linear relation to GDP. Japan and China, however, at least in recent years, have increased the number of patents filed per GDP. This may be due to confidence toward the respective patent systems and the value of patents for economic growth. In our next post, we’ll look at trends in resident versus non-resident patent filings in the IP-5 to shed additional light on the optimism toward each of the different IP-5 jurisdictions.

Data Sources:

  1. WIPO Facts and Figures 2018
  2. World Intellectual Property Indicators 2018
  3. Annual Real GDP Statistics for U.S., China, South Korea, Japan, and EU: https://data.worldbank.org/indicator/NY.GDP.MKTP.CD
  4. Annual Patent Filing Data for IP-5 (2011-2017): IP-5 Statistics Report 2011-2018, Four-Office Statistics Report (2008 – 2010), World Bank Indicator https://data.worldbank.org/indicator/IP.PAT.NRES, and WIPO Statistics https://www.wipo.int/ipstats/en/statistics/country_profile/profile.jsp?code=CN.

Featured on:

Groen zwart.png

US Patent Filings: Peaking or False Peak

By Ian C. Schick, PhD, JD, CEO & Co-founder of Specifio (first posted on blog.specif.io)

Annual patent filings appear to have leveled off at the USPTO in the first slowdown since the financial crisis of 2008. Is this a sign of a sustained plateau or even decline in annual filings? Or are the last few years just noise in an ever-increasing trend?

A look at the economics of patent preparation over the past decade may provide some explanation for the recent falloff in US patent filings. For example, consider the collision of these three trends: (1) stagnant fees for preparing patent applications, (2) increasing costs for law firms to generate patent applications, and (3) a labor shortage of junior practitioners to prepare applications. In this article, we will examine these market trends to offer a greater understanding of the current state of the patent-preparation market and where it may be heading in the future.

In the last decade, average fees for preparing and filing patent applications have remained quite stagnant. For software-related patent applications in particular, the average cost has been hovering around $11,000. It’s as if “buyers” and “sellers” of patent preparation are at an impasse over the value of drafting patent applications. This trend also coincides with the bi-annual release the AIPLA’s Economic Survey, which began in 2007 providing the first industry-wide visibility into fees charged by competing law firms (we’ll be looking further into this in a future blog post).

While fees have remained static, the costs associated with preparing patent applications, such as salaries and overhead, have been on the rise, slimming profit margins and creating significant cost pressures for law firm patent practices. The average annual salary for patent associates with less than five-years of experience, for example, has trended mostly upward since 2007.

Firms have responded to the revenue and cost trends in a variety of ways, but the most common reaction seems to be pushing the work down to individuals with lower billing rates. Increasing reliance on junior associates and patent agents for patent preparation, however, may be an unsustainable approach to cope with shrinking profits per app, which leads us to the third market trend.

The number of new patent practitioners has dropped by roughly 50% in the last decade. This is illustrated by the steady decline in the number of individuals passing the patent bar each year over the past ten years. According to the AIPLA Economic Survey, less than 7% of practitioners were under the age of 35 in 2017 compared to 13.2% in 2008, further demonstrating a decrease in early-career practitioners. Increasing reliance on this group of practitioners, due to shrinking margins for patent prep, is directly at odds with a shrinking pool of candidates.

Have the three market trends outlined above reached an equilibrium or are we at a tipping point for major change in the patent industry?

Are we at a tipping point for major change in the patent industry?

Taking a more historical view of patent filings in the US, a different picture emerges. Maybe we really are at the end of roughly three decades of steady growth. Alternatively, one could argue that annual patent filings should parallel the acceleration of technological innovation and, thus, these last three years are likely just a blip in an otherwise exponential increase in patent filings.

In some ways, the historical trend in US patent filings is reminiscent of Moore’s Law and transistor size. Many times since Gordon Moore made his famous prediction, the semiconductor industry feared that transistors had become as small as possible due to a “fundamental limit” only to see a breakthrough enable several more years of exponential increase in transistor spatial density.

Perhaps the patent preparation industry is awaiting a breakthrough to enable continued growth in annual patent filings to keep up with innovation. Gaining efficiency, in the form of lower per-app costs and higher per-practitioner drafting capacity, is clearly a requirement to continuing an upward trend in annual patent filings.

Greater efficiency could include optimizing human processes such as patent preparation and other pre-issuance activities. One could imagine future legislation simplifying the statutory requirements of patent applications to make preparing them more efficient. More immediately, however, human process innovation seems more likely to include growing adoption of outsourcing, offshoring, or other alternatives to the traditional law firm model for patent preparation.

Technical innovation provides another clear avenue to continued growth in annual patent filings. Several “PatentTech” companies have emerged in recent years in both document automation and patent process automation.

Leveraging AI, modern document automation goes beyond simple merges and form-filling. It can look at context, writing style, format and content requirements, and other characteristics to create or correct text. Existing examples of document automation include automated patent drafting, auto-generated patent figures, patent-specific proofreaders, and office action shell generation.

Process automation relates to non-writing tasks in the patent preparation and filing process. Examples of process automation on the market now include patent docketing, patentability searches, creating and managing information disclosure statements, and client reporting.

Ostensibly, the trends of stagnant fees, increasing preparation costs, and labor shortage could serve as threats to the patent industry, but they may actually be doing quite the opposite by driving PatentTech innovation. Regardless of the direction annual filings end up taking, advances in process automation and document automation are creating greater efficiencies within the industry. Practitioners and patent owners benefit alike with better work product and less rote and mundane work per application.

Data Sources:

DISCLAIMER: The views and opinions expressed in this article are those of the author and (1) are not provided in the course of and do not create or constitute an attorney-client relationship, (2) are not intended as a solicitation, (3) are not intended to convey or constitute legal advice, and (4) are not a substitute for obtaining legal advice from a qualified attorney. You should not act upon any such information without first seeking qualified professional counsel on your specific matter. The hiring of an attorney is an important decision that should not be based solely upon Web site communications or advertisements.